Computer Science AS
Introduction Information Representation Communications Communications 2 Hardware Logic Circuits Processor Fundamentals Assembly Language Monitor & Control System Software Security, Privacy & Data Integrity Ethics DatabasesAS Practical
Algorithm Data Structures and more Software developmentComputer Science A2
Data Representation File Organisation Advance Logic GatesInternet Virtual Machines System Software Encryption & Security Artificial IntelligenceA2 Practicals
Binary Search Linear Search Bubble Sort Insertion Sort Combined Algorithm Stacks Queues Linked List Binary TreeMore
Reference Pastpaper Questions
Artificial Intelligence
Dijkstra's Algorithm
Many textbooks give unnecessary information such as the code for Dijkastra's Algorithm. This is unnecessary and you are only required to know how the code works and does. Below is a summarised note on how the algorithm works
Points are considered to be nodes. Note that these nodes are graphical and theoretical. These nodes can represent a location or destination or even a decision to take...
1. The Starting node is set to 0 and all other nodes are sent to infinity
2. The smallest adjacent node route is considered. The value of the distance is checked whether it is lower than the stored value of the node. It should be as the node was inititally set to infinity. If it less then we set that current node with the distance value \ edge value
3. Then it checks any nodes adjacent to the current node and goes towards the lowest distance node. If the SUM of the distance (previous distance + distance taken to move to current node) is less than the current node value, then it is updated
4. It will show the total distance for a single route or possibility of the diagram. Now the remaining nodes should be explored and adjusted until it reaches the end node
5. Sometimes the values of the node may get adjusted more than once as there is a more efficient and lower distance diagram
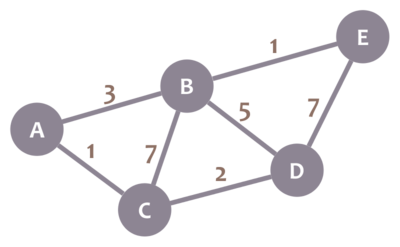
To understand it more, I got a small graph from the internet below.
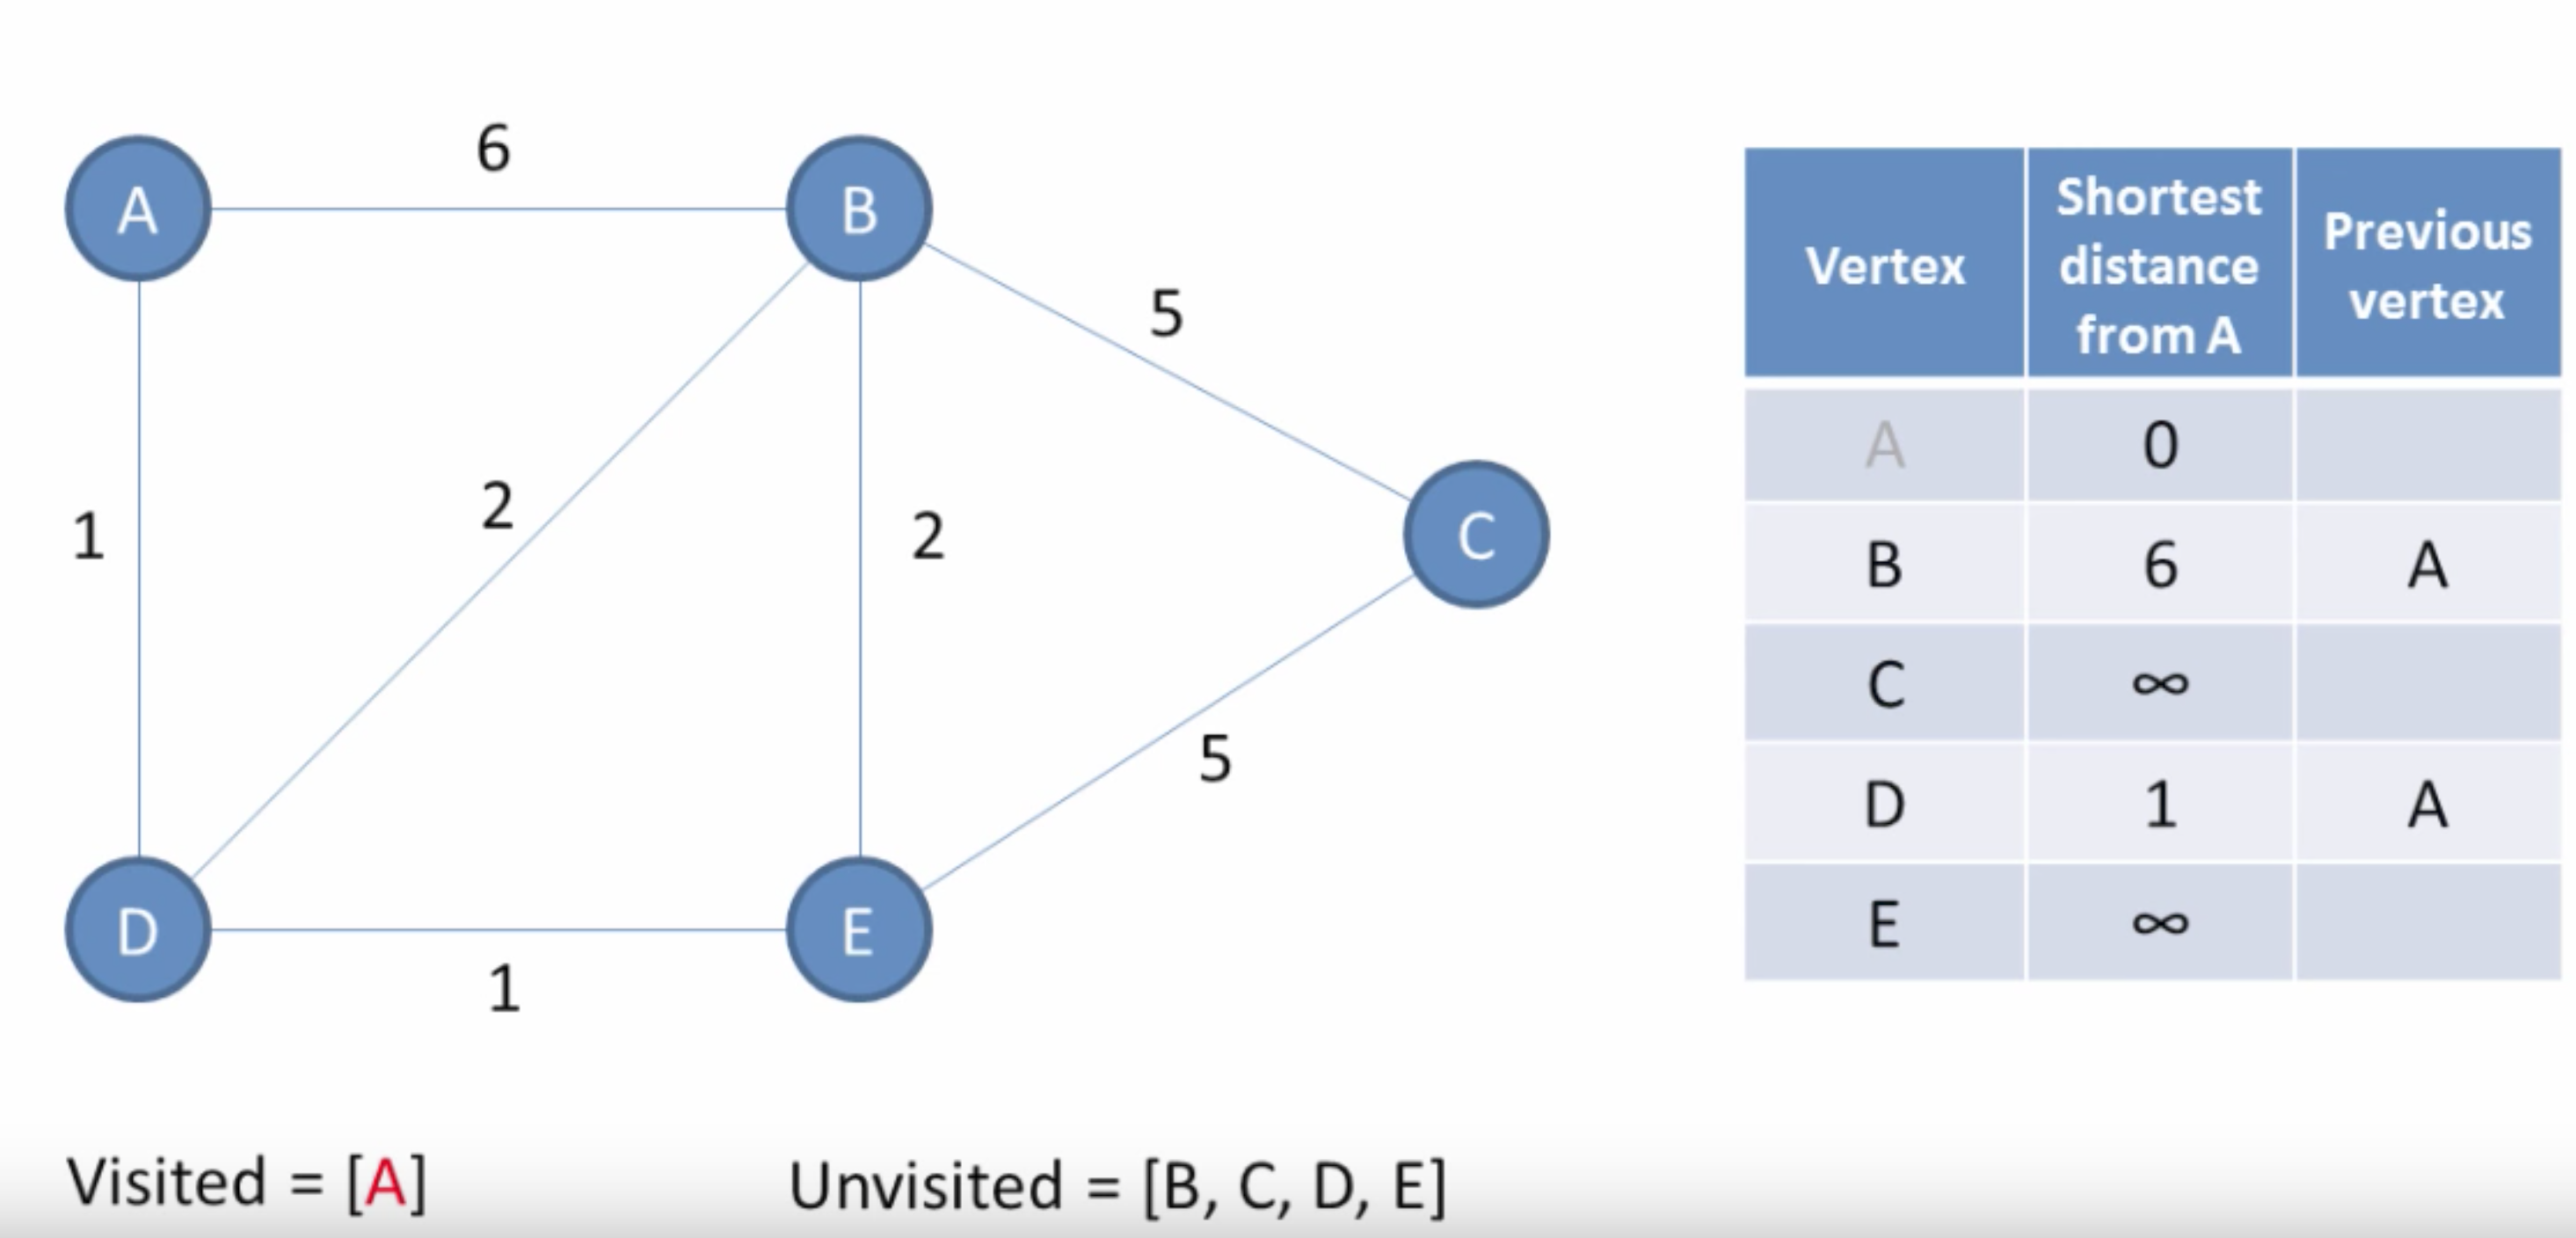
First it records the distance of adjacent nodes and if it is less than infinity or the previously stored value of the node, the node is then updated
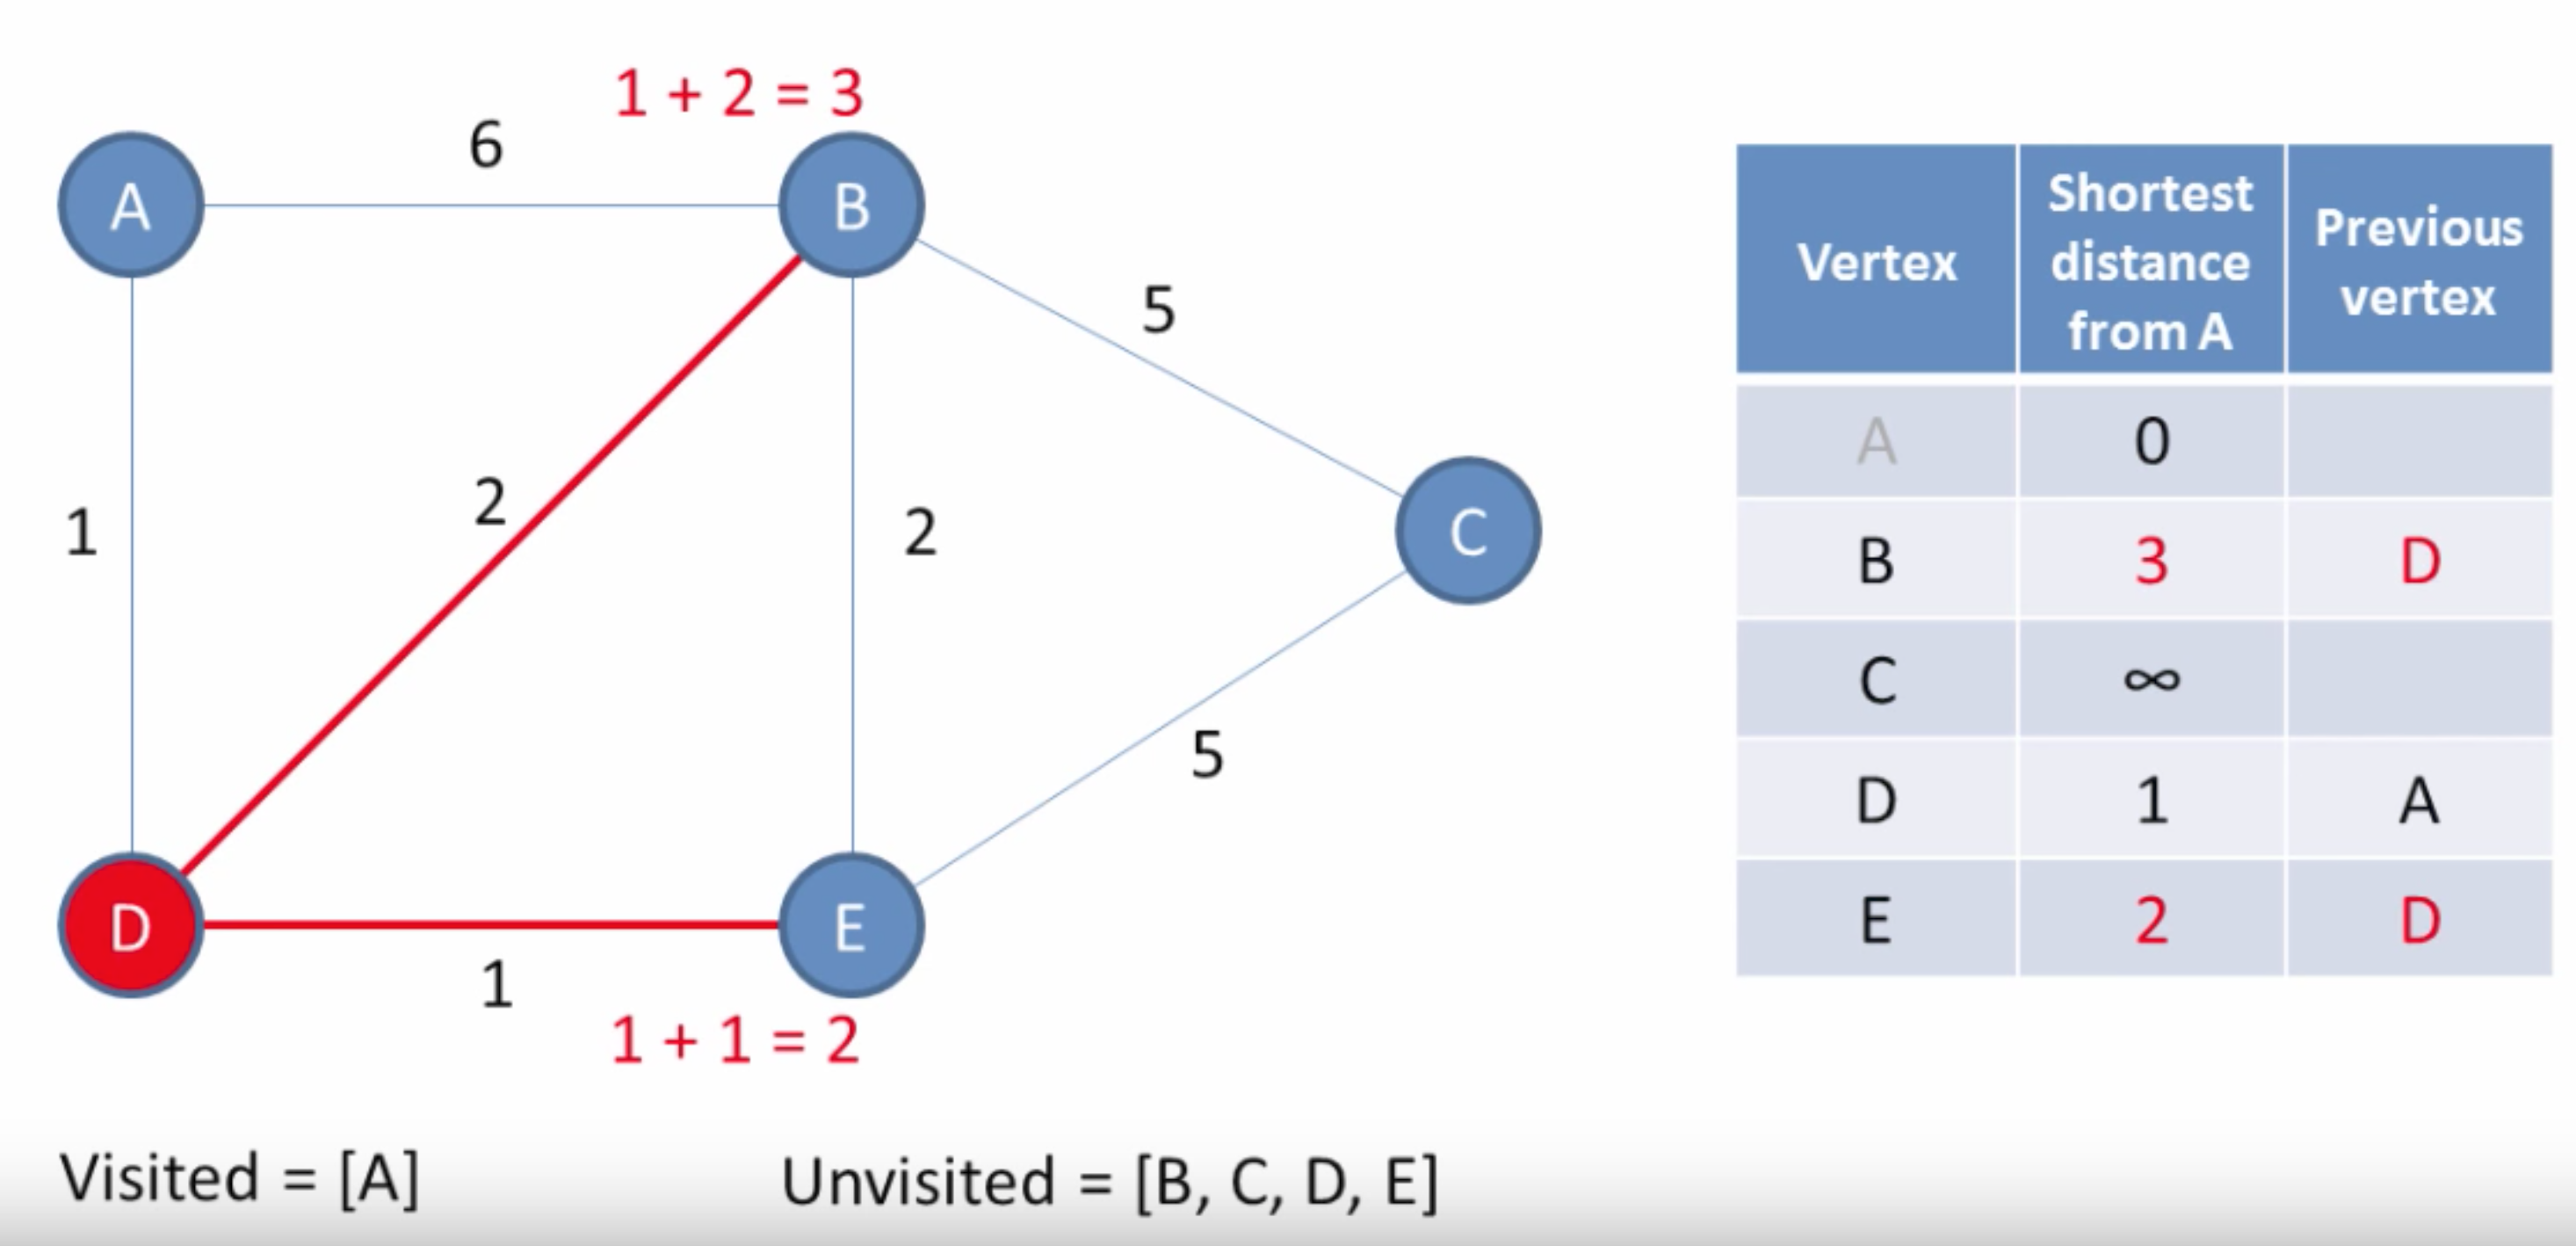
It goes initially at the shortest route and then explores adjacent nodes again
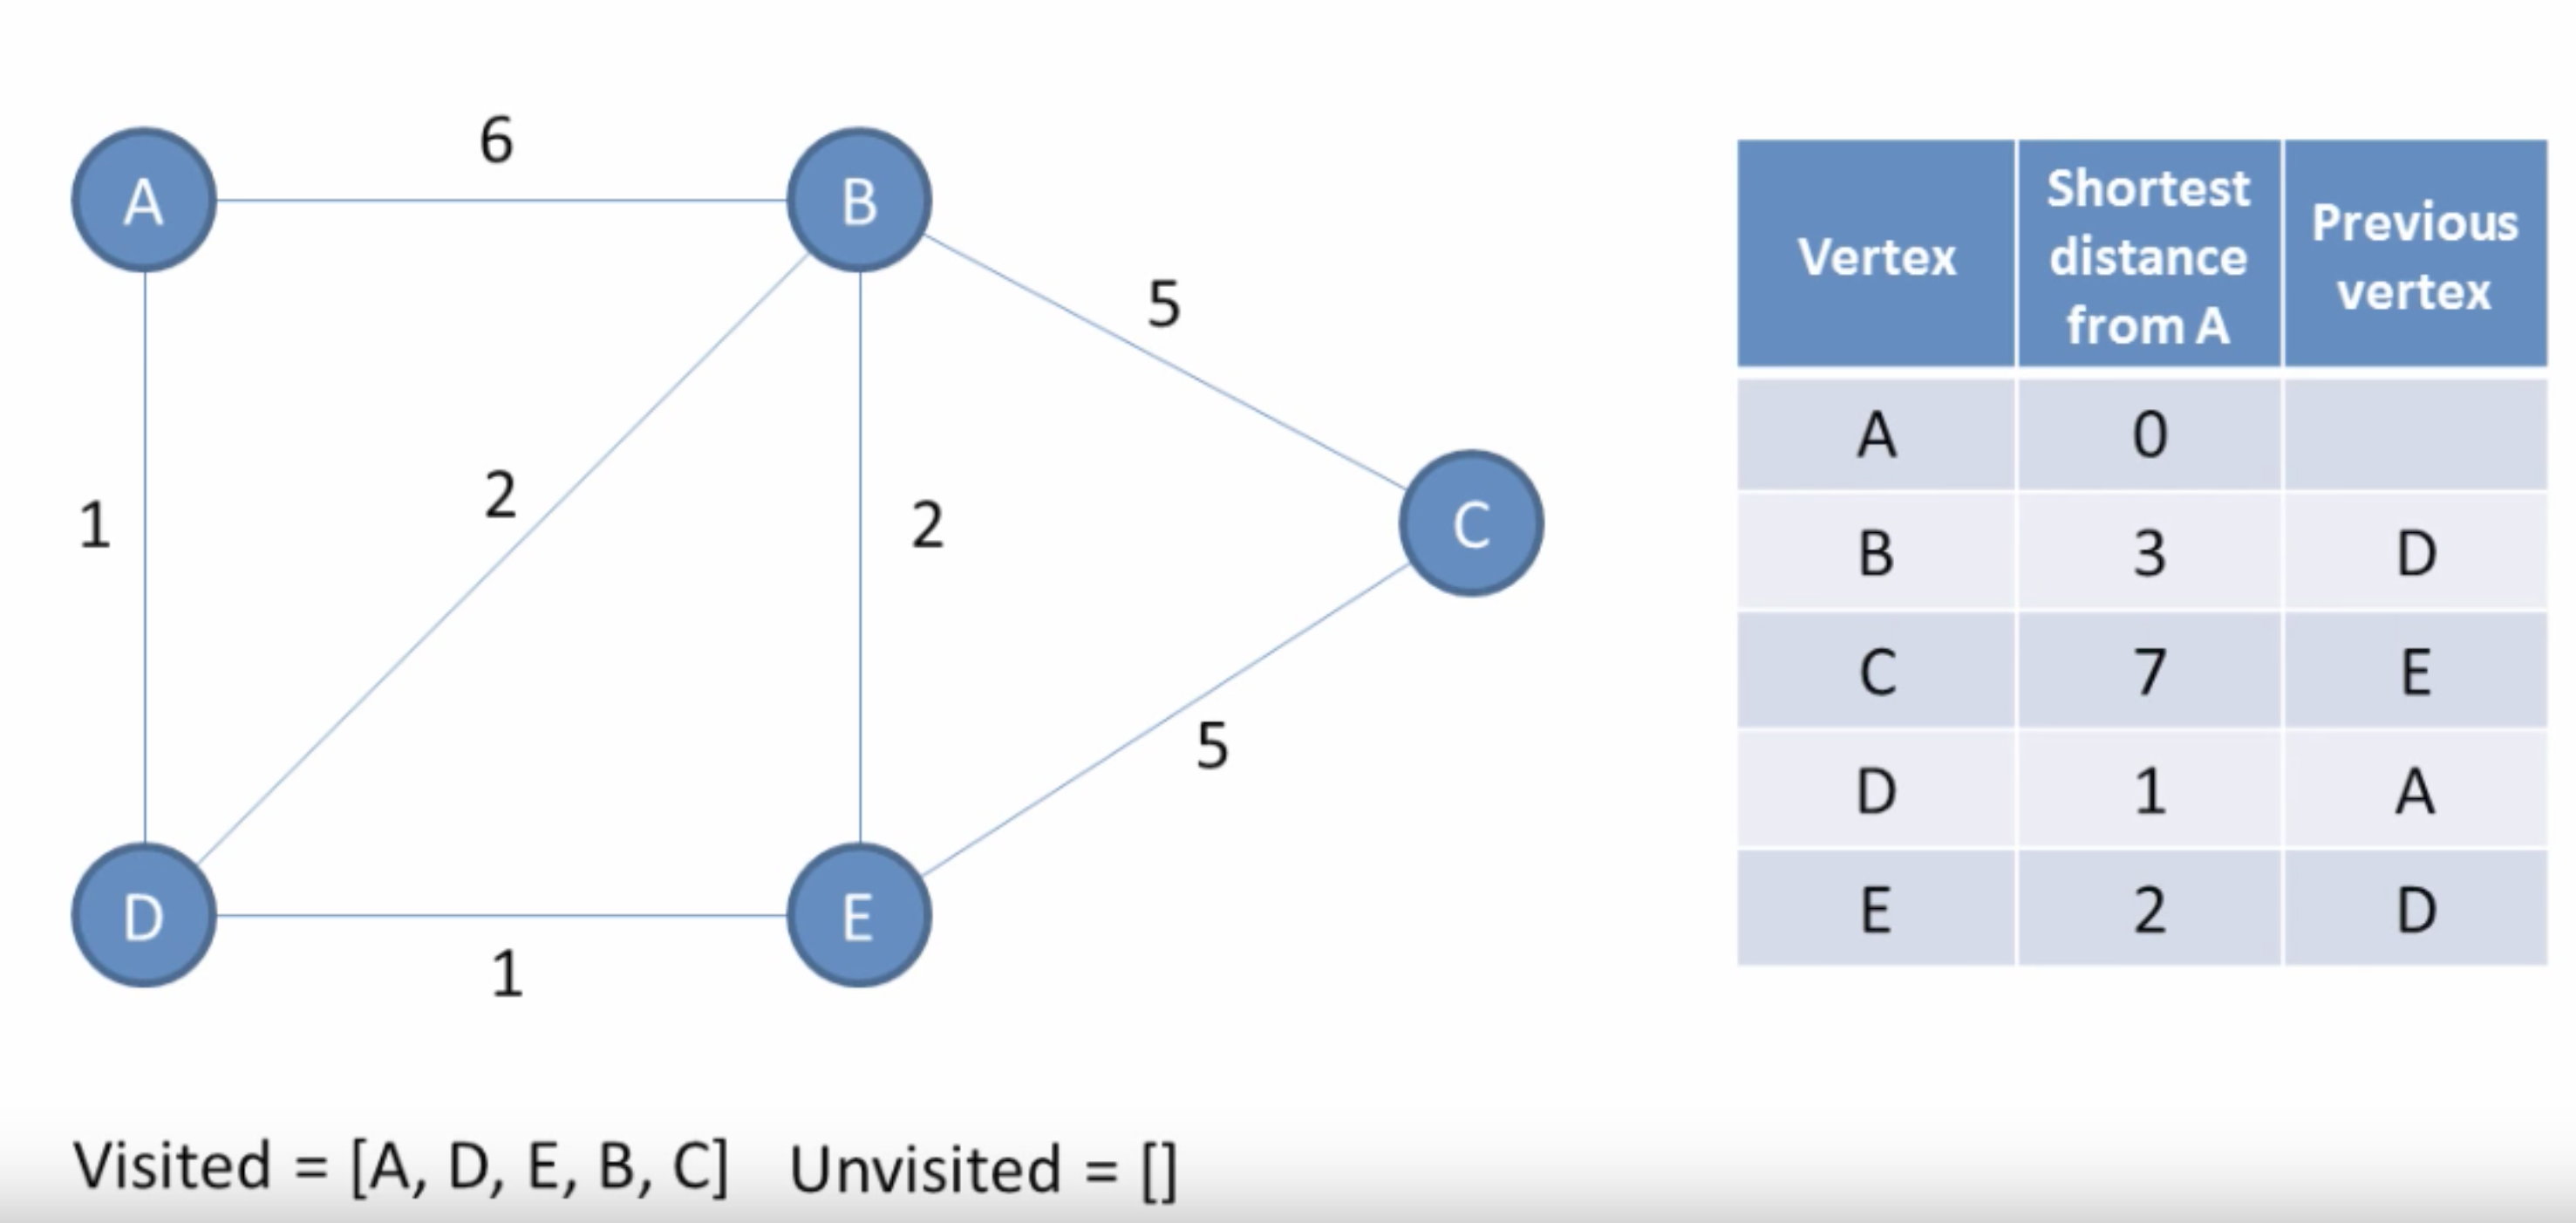
After a single route is finished, remaining nodes are then considered
Note that Dijkstra's Algorithm must consider all possibilities to see which route is the shortest. You also need to trace the graph by updating the values of each node for each route
A* Algorithm
This is more improved version of the Dijkstra's Algorithm as not all outcomes or routes have to be considered
The concept is similar to the above code. However, in addition to the above, each node has a unique coordinate. For example the start node has the coordinate 2,3 and the end coordinate has the coordinate 5,8
By applying this we can find the shortest possible distance or route it can take which is the displacement. Here is the way to calculate the displacement between the start and end node
(X1-X2)2+(Y1-Y2)2 = Displacement
This is the pythagoras theorem used to find distance between two points or a line. This function is called the heuristic function
So the displacement or the heuristic value between EACH node and the end node is calculated. This gives us the idea that the length can not be shorter than this
So when a single route has been discovered and the sum is recorded for that route, then another route can be discovered but if the distance to that node plus the heuristic value is greater then there is no point going further that path as the path distance is definitely going to be larger.
I have put video to explain how it works down below
Machine Learning
The process of learning from experience to improve its performance
There are 3 types of Artificial Intelligence learning depending on the data they handle and their specialty
- Unsupervised Learning
- Supervised Learning
- Reinforced Learning
Handles and takes in large amounts of unlabeled or categorized data that outputs categorized data
Uses categorized and labeled data and processes it to perform a specific function such as send out analytic reports
An example is the youtube or Facebook analytic feeds that tell you how many views for the past 28 days
A system that handles both labeled and unlabelled data and learns from experience to optimize its future task and functionality. It uses rewards to reinforce the machine to indicate that it is getting better and better
An example would be a chess computer that rewards or punishes every move it makes depending on how effective the move was
Regression Analysis
This is by finding patterns in large collections of past data to predict future events or suggestions. For example, you may have done scientific experiments where you need to draw graphs and draw lines of best fit or curve. Using the graph, you can predict other values that you have not tested so as long there is a trend then the machine can predict.
If it is a linear pattern ( line of best fit ) it is called linear regression, other complex ones are called polynomial regression
An example is a school system seeing a trend between Maths and Science Student's Marks. The higher the mark for one subject, the higher they are for the other subject. Another popular system is Google, where they use it to give search suggestions
Note that Categorized data means data that have some form of labeling and can be identified or in other words, it is highly specific data
Artificial Neural Networks
This is based on the idea that the structures and complexity of neural networks in our body give some form of intelligence and so it is used in real-life AI
This is very interesting indeed and has been very beneficial to us. I will explain this briefly so you can understand
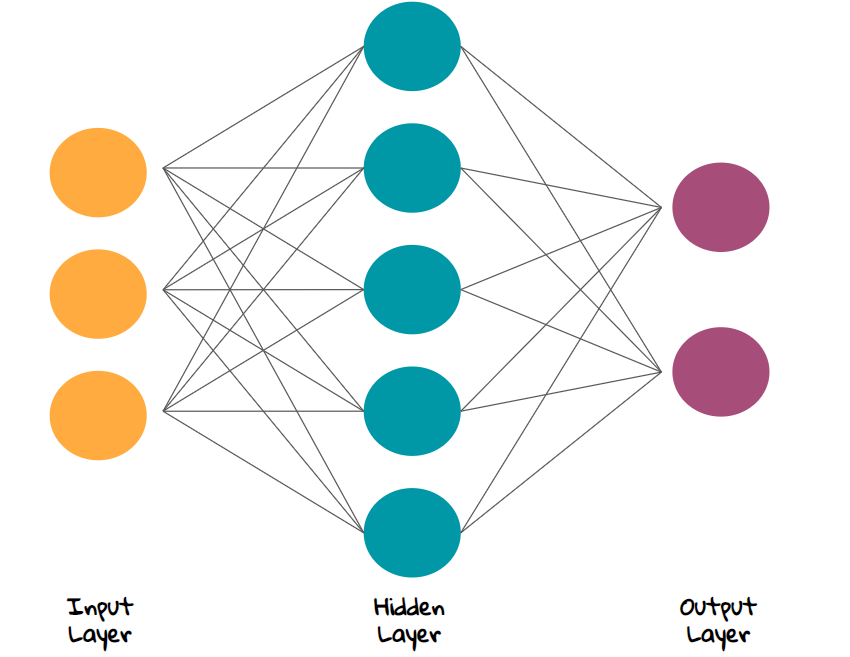
Using the diagram, the first layer or the first set of nodes on the left side are called inputnodes/layer
The Nodes on the right are called the Outputnodes/layer
The Nodes in between are called Hidden layers. Note that there can be many layers in the hidden layer
Note that this is a graphical representation. It could be hardware or software
Say we need a software that uses AI, it must take in input values that give values close to the real values. In other words, the prediction must be close to the real value
The Nodes each have a weightage that adds or multiplies the value it receives and outputs to the next node. The problem is at the start, the weightage each node has is incorrect or not calibrated
The system will be given past actual data and give results. However, it's unlikely to give the expected correct result. So this can be compared with actual results to see how deviated the calculated result.
By doing this, the system can adjust the weightage of each node so it will give close to the exact value. This process is called the backpropagation of errors. The adjustment occurs from the output nodes first and then it adjusts the node until it reaches the input layer nodes
Back Propagation of errors is the process in machine learning that optimizes the value for the adjustable parameters. The adjusting process occurs from the output layer nodes to the input layer nodes
Forward Propagation of errors is very similar to the backpropagation of errors but the direction of adjusting is reversed.
Deep Learning
It is Artificial Machine Systems that uses Artificial Neural Network and has many hidden layers to handle very complex task
These are the type of AI you may have watched in movies. Where there AI specialty is clearly visible
Recommended
These are things you might like. Clicking these ads can help us improve our free services in the future...