Physics AS
Introduction Physical Quantities & Base units Vectors & Scalars Kinematics Pressure & Density Dynamics Momentum Energy, power & efficiency Deformation of solids Waves Superposition Stationary waves Electric fields Electricity Circuits & Kirchoff's laws Radioactive Physics AS PracticalPaper 5More
Reference Pastpaper Questions
Paper 5 Analysis
This question is similar to the 1st Question but there is no planning here. This mainly focuses on handling with real data and organising data to graphs to see relationships
What to expect...
They will certainly start with an experiment or an diagram with an equation.
E = I (R/n + r)
The first question will be always to convert the equation to y = mx + c form which we have done in the first question, this could include an exponential equation or even a linear equation
They will usually state what the y - axis and x-axis must be and they will ask to find the expression of the gradient
E = I (R/n + r)

y=1/I x=1/n

1/I = ( R/n + r )/E

1/I = ( R/n + r )/E

1/I =  (1/n * R/E) + r/E

y   =    x *  m    +  c

so m = R/E
This will always be the first sub question of part 2
Acing the table
After they will ask to fill the values of the table for different values in the table using the equation which is quite straight forward and doesn't require any further explaination but the only things to consider are the prefixes. For example the heading of the table maybe in the form below:
| I / 10-3 A | V / 10-3 v |
|---|
This literally means that the values displayed in the table are milliamps and millivolts so the readings in the table must be multiplied by 10-3 to get the real values.
This is important especially when you need to find the final value or the gradient in the right magnitude so we need to convert all of them to the right values when calculating the gradient
Another big problem is calculating the uncertainties of the final values of the table and this is because the readings already have their own uncertainties. Most of the uncertainities are covered in this chapter but there are also some new ones you may not be familar with
Uncertainty of Lg
There are two ways to do this but they are almost the same
We will take the example of log(8±2). Now the final value of log(8) is 0.903.... but how to find the absolute uncertainty
Find log(8+2) = 1

Find log(8-2) = 0.778...

1 - 0.778 = 0.2218

Then divide by 2

±0.1109

//Usually the uncertainty is given to one decimal place
But in paper 5 these rules don't apply and you put into the same decimal places
which the final answers are supposed to be put according to table rules

so the final value will be 0.9±0.1
The other method is almost the same
 Find log(8) = 0.903....

 Find log(8+2) = 1

 1 - 0.903 = 0.0969

 so final value is 0.9±0.1
Plotting the graph
Plotting the graph is relatively easy but the detail is very important so use crosses
Also we need to mark the error bounds and this is the range for each point. You must use the absolute uncertainties you got in the table and draw a small range using arrows for that uncertainty for each point
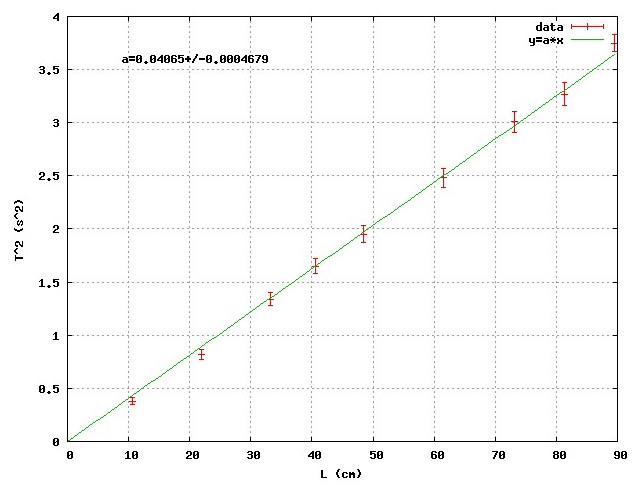
In some cases, the uncertainty calculated are very small, for this we may have to round the uncertainties to 1 decimal point
Then you draw the best fit line to make sure the line passes as close to all the points and are with in the range of the error bounds
Finding Gradient & the Worst Gradient or Worst fit line
Finding the gradient is relatively easy and all you need to know is here but always remember to convert the values to the correct magnitudes / prefixes as the marksheme usually dont have units for the gradients
But what you are new to is the worst line fit or worst gradient. In other words, it means the most outlined gradient. For you to find this we need to draw another line but this time we draw from the bottom of the last error bound to the top of the largest value like this:
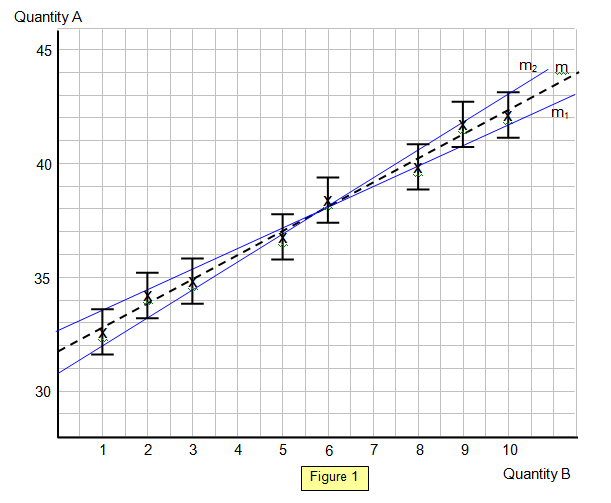
The same can be done the other way by reversing it also
After finding the worst gradient line and the normal gradient, we then find the difference between the two values and this is now the absolute uncertainty value of the gradient. Remember this point
Absolute uncertainty of Normal Gradient = Worst Gradient - Normal Gradient
Use of the Gradient
As you can remember the question starts us to find an expression for gradient which was:
m = R/E
So now we can substitue the calculated gradient in the expression and they will give the value of one variable for example R
Finding the missing value is very easy and includes just making E the subject and substituting the values but the next part of this sub question asks you to find the absolute uncertainity of the value E
Again remember that we noted down the uncertainty of the gradient and most likely they will also give the uncertainty of the variable R. Then by following the simple rules set here you can find the answer
Recommended
These are things you might like. Clicking these ads can help us improve our free services in the future...