Physics AS
Introduction Physical Quantities & Base units Vectors & Scalars Kinematics Pressure & Density Dynamics Momentum Energy, power & efficiency Deformation of solids Waves Superposition Stationary waves Electric fields Electricity Circuits & Kirchoff's laws Radioactive Physics AS PracticalPaper 5More
Reference Pastpaper QuestionsPaper 5 Planning
As my School Teacher always used to say, paper 5 is no real biggie... There is a clear set of pointers you need to remember when we are doing the first Question. This Section will focus on the Question 1 of Paper 5.
What we need to be familar with is that the Question 1 is always based on designing an experiment of a particular equation to test
What you need to include...
When testing and proving a statement or an equation you will have to carry out certain things
As an example:
T = k√(l/g)
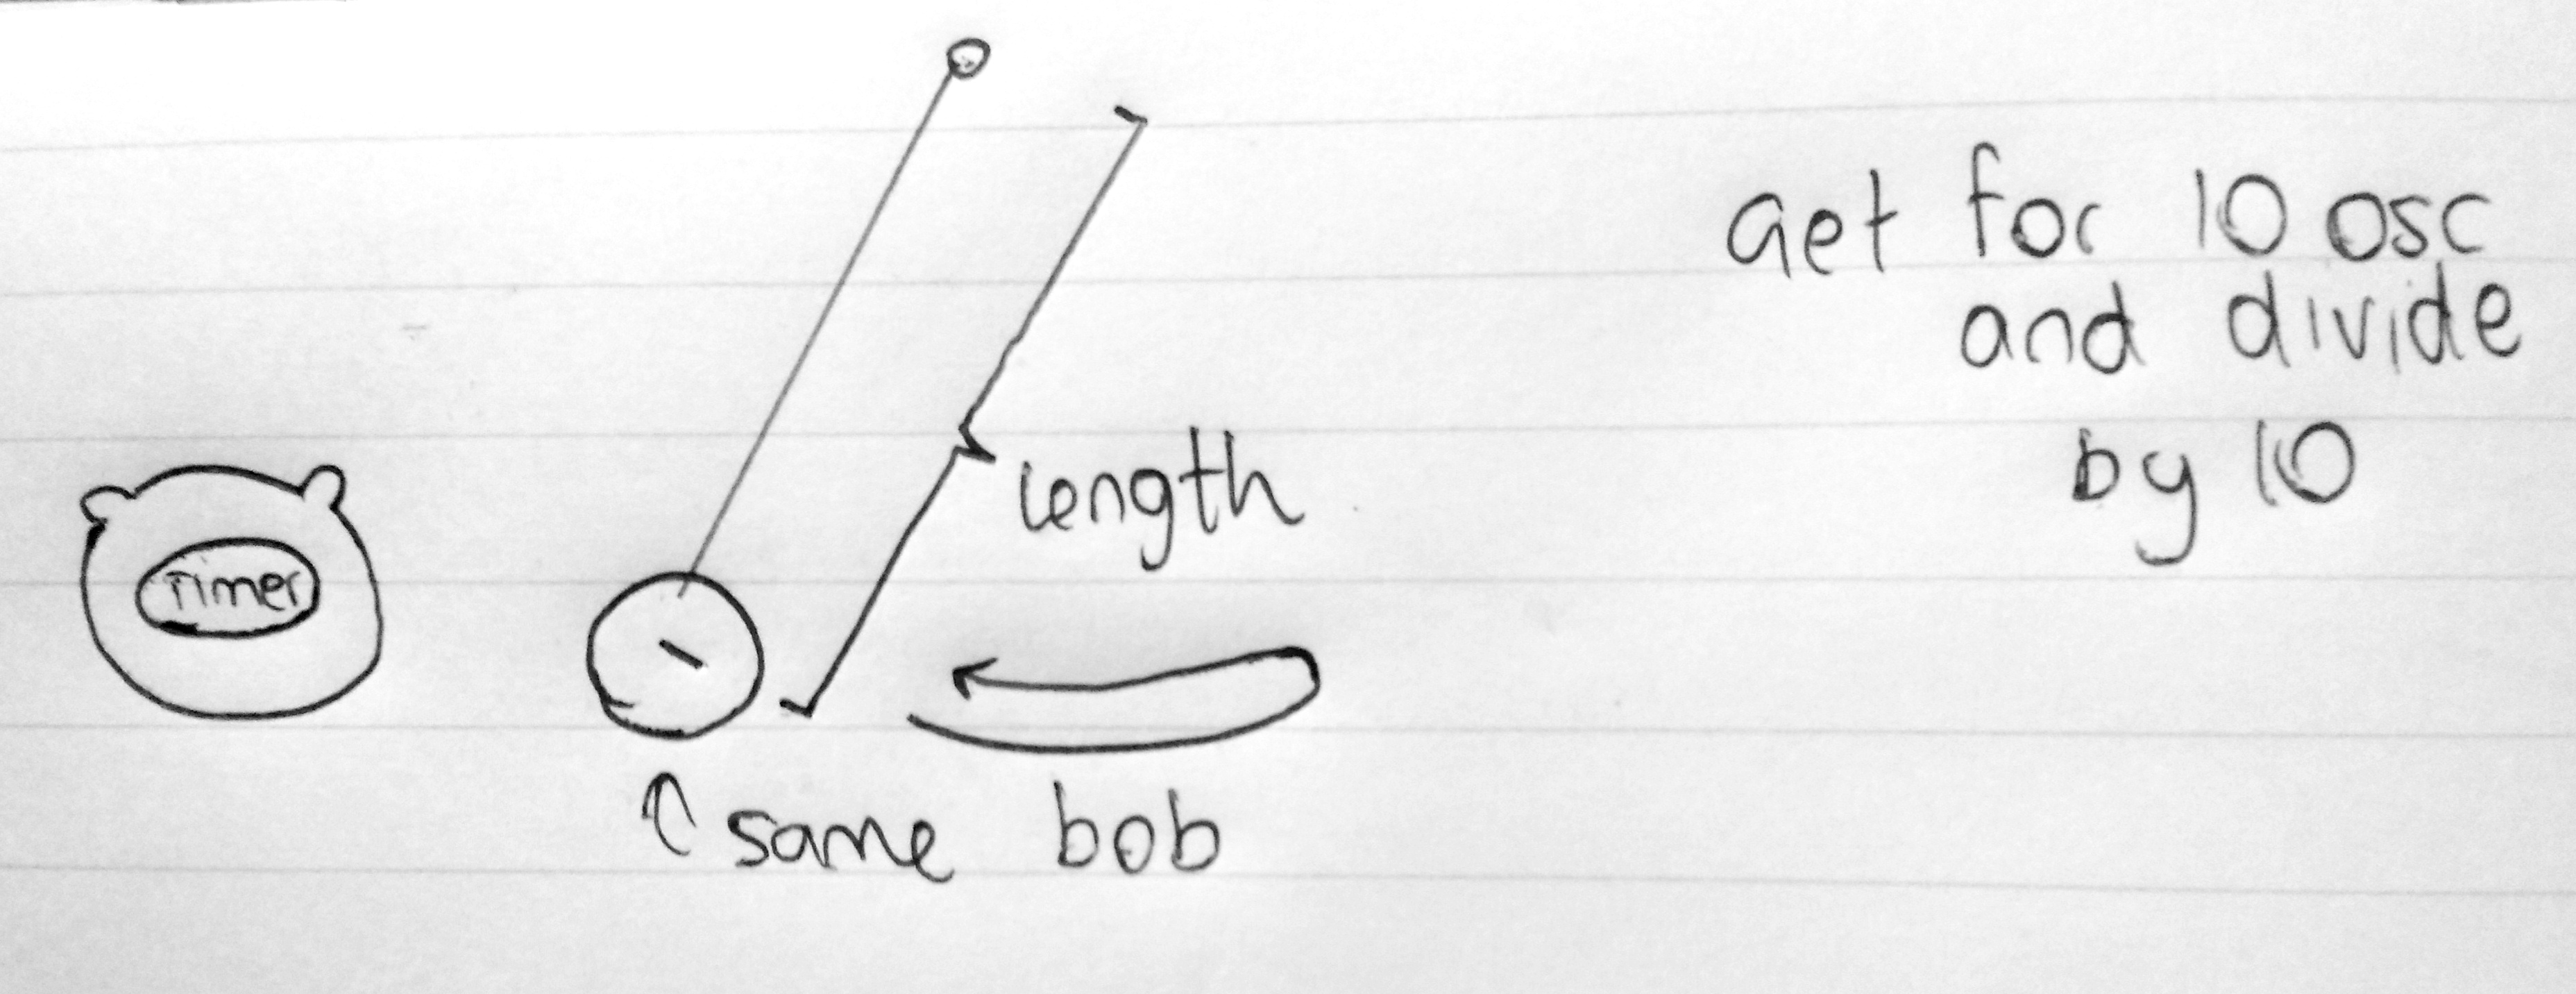
- The diagram
- Identifying the Independant & Dependant variables & Controls
- How is it measured
- Identifying other variables
- Proving the relationship using a Graph
Usually the question comes in the form of a difficult equation in which the relationship between the independant variable and the dependant variable must be proved
Notice that this could be represented in the form of T2 ∝ l/g

Make sure you draw a clear diagram of the experiment and label how the independant variable can be changed and how the results can be measured. Also include some extra apparatus used
The first set of marks is when you identify the independant variable ( l or length ) and the dependant variable ( T or Time ). Also it is necessary for you to mention what you will keep constant but in this case we can comment that we use the same bob or same size and mass of bob or using the same enviroment ( No fans switched on ) and others. These are the things you control and keep constant
Now you need to mention how the independant variable can be changed and measured. Remember being precise and detailed helps you score marks such as saying use a ruler to measure the length from the center of the bob to the pivot and the length can be altered. The dependant variable can be measured using a timer or stop watch
How you get further marks is being smart and being reliable. For example it's safe to mention to measure the time for 10 oscillation so you can average and find the time for one oscillation more accurately. You also can mention that you can take a large spread and range of values for length
You also need to mention how other variables in the equation can be measured and be constant. In this simple example, there is no neccessity for us to prove that Gravity is 9.81ms-2. But in other harder, questions you may have to
For some questions, there could be more than one variable you have to measure and which remains constant. For example, for some you may have to find the density or pressure and it is a must that you mention the equations to derive the other variables in the equation
For example:
pressure ∝ height * density
It will be that height can be changed and the pressure can be measured but, density is still needed for you to calculate. So you need to say that you need to find the mass of the liquid ( by taking difference in masses ) and also find the volume of the liquid to find the density
These are under additional points of the mark sheme and they mainly look for other equations or variables needed to be calculated
Now you need to say that we need to plot a graph of the independant variable against the dependant variable but the equation must be converted to the y=mx+c form
y = mx + c
The reason we do this is to find some form of linearity or proportionality ( constant ) which can be represented due to the constant of the graph
Below are some most common equations forms converted to the y = mx + c forms
| Name | Example | y = mx + c | Explaination |
|---|---|---|---|
| linear | F ∝ m | F = k * m | A simple relation in which a constant is formed |
| Square | T ∝ √l/g | T2 = k * l | We can plot a graph of T2 against l. This is because g is a constant so it is included in the gradient k |
| Exponential (log) | T = axn | log(T) = log(a) + nlog(x) | Using simple laws of logarithm, the equation can be converted to a linear equation where log(T) is y and log(a) is the y - intercept and n or log(x) is the gradient |
| Exponential (ln) | T = exn | ln(T) = 1 + nln(x) | Using simple laws of logarithm, the equation can be converted to a linear equation where ln(T) is y and 1 is the y - intercept and n or ln(x) is the gradient |
Plotting the Graph
You must then draw a small sketch of the graph and annotate the y-intercept and the gradient and the axises
Additional points
In the marksheme there is a small part for additional points and some of them include the ones mentioned above but these are some of the most common points:
1. Including Equations to derive other variable or methods to find other variable / constants
2. Methods to improve accuracy such as taking many values and finding average or parralax errors
3. Mentioning not so obvious safety precations such as using heavy blocks to stabilise the stand or using a a sand tray to collect spillage
An Example
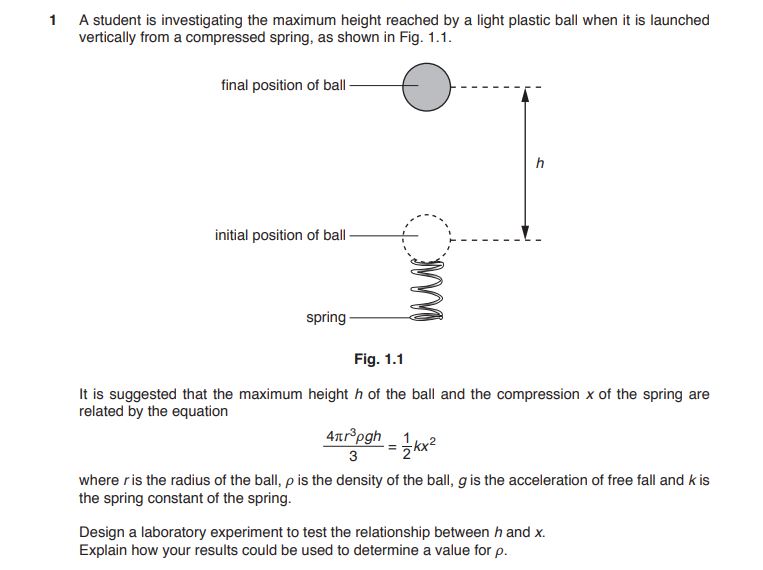
To understand what must be included, let us take a past paper example...

Model Answer...

The independant variable is the compression x and the dependant variable is the maximum height of the ball which is h. x can be found by finding the differences between the lengths by using a ruler where as the height can be measured using the difference in height by using a ruler
The density and radius of the ball must remain constant and that can be be found by using a vernier caliper to measure the diameter inorder to find the radius and then you have the measure the mass of the ball using an electronic balance ( Note: mass will be different but it is not part of the equation ) so then after finding mass and radius you can use the equation:
Volume = 4/3πr3
Density = Mass/Volume
So both Density and Radius must remain controlled and constant. Also make sure other factors also remain constant such as using the same spring and using the same set up for each experiment
You also must calculate the spring constant of the spring and that can be done by find the force(using loads) to extend different extensions so a force-extension graph could be plotted and to find the average spring constant or you can use the mass of the ball and find weight (isolated) and find the extension/compression to find spring constant
Then take different values for x and find the output height and do this many times and record it in a table. Make sure the maximum height is read and the eye level must be on the same level as the final position. To improve this you can use a video camera and shoot the footage frame by frame to see the maximum height reached
//Converting to y=mx+ch=constant*x2
Then plot a graph of compression (x) on the x-axis and the height on the y-axis

If the graph is able to be represented using a straight line then the gradient remains constant and the relation ship between x2 and h is satisfied and it shows that when the compression is doubled then the height will increase by 4 times
Safety precautions: experiment must be carried in a sand tray as the ball will safely land on the sand. It's better to wear face gear or protection gear incase the ball hits your face. Make sure the spring is tightly fitted to the table
Some additional points that can be used to improve accuracy is to take many readings for the veriner caliper in different directions and average it to find the accurate radius and you can use a video camera and also you can use a set square to make sure the ruler is perpendicular and measure the values at eye level to avoid parralax error
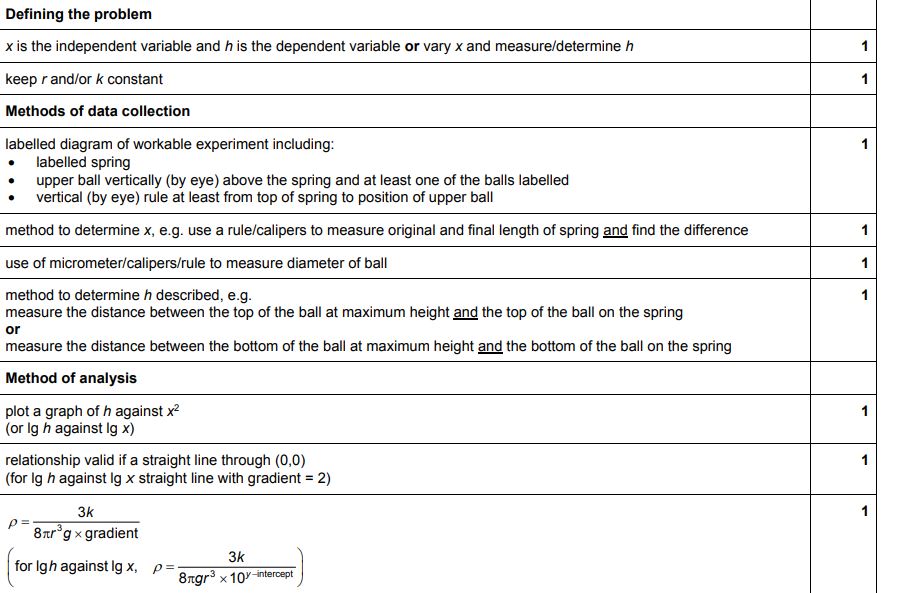
Marksheme...

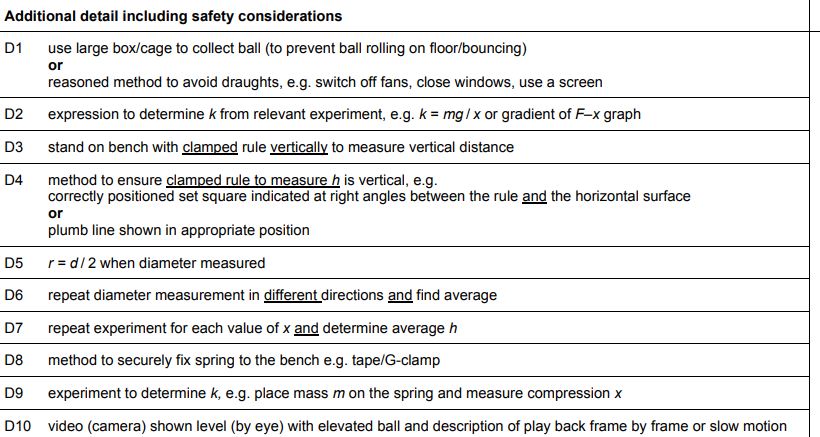
And the additional points

Recommended
These are things you might like. Clicking these ads can help us improve our free services in the future...
