Chemistry
Introduction Moles Empirical Formulas & More Atomic Properties Ionisation Energies Bonding Intermolecular Forces States of Matter & Ideal Gases Giant Covalent & Ionic Structures Enthalpy Change Hess's Law Reaction Rate Equilibrium Redox Reactions Periodicity Group 2 Elements Group 7 Elements Nitrogen & SulfurOrganic Chemistry
Introduction to Organic Chemistry Organic Reactions Alkanes Alkenes Halogenoalkanes Alcohols & Carboxylic acids Aldehydes & Ketones PolymerisationMore
Reference Chapter Questions
Reaction Kinematics & Boltzmann's Graphs
How do we measure rates?
There are many ways which we can use to measure the rate of a reaction. This involves in monitoring a change in physical property over time
For example, a color change reaction will use a colorimeter to check the change in color over a period of time
Nevertheless, this fundamentally measures the change in concentration of products or reactants over a unit period of time
Rate = δConcentration/δTime
The above equation gives the rate of change in concentration. This is the rate of reaction at a particular point or time. We could also find the average rate which covers a large period of time
Average rate = Change in Concentration/Time interval
This is how we measure the rate and we usually create a table and plot a graph. The graph helps us to determine the rate at a particular point using a tangent to a point
We can do this for almost at any point of the graph but exams commonly ask to measure the intial rate ( T = 0 ) as this is used to compare rates of different reactions
What causes a reaction to occur?
The current and the next subheading are quite similar but, this talks about the fundamental basis why reactions occur
For any reaction to occur it must satisfy 3 conditions:
1. The reactant particles must collide
2. They must collide successfully ( collide with the minimum energy required (activation energy) for a reaction to occur )
3. They must collide with the correct orientation( derived from point 2 )
We will discuss what is activation energy and catalyst later. Now we will take about the factors which increases these fundamental conditions
Factors Affecting rate
There are 5 Main Factors which affect the rate of the reaction and most of them have positive correlation(when it increases the rate also increases). For each factor we will give the model answer which will cover all of the marks possible
- Surface area
- Concentration
- Pressure
- Temperature
- Presence of a Catalyst
- Homogeneous Catalyst
- Heterogeneous Catalyst
Larger the surface area the larger the contact area and higher the opportunities for collisions between reactant particles. So greater successful collision frequency and so the rate increase with surface area
Please note the Succesful and Collision frequency keyword because as highlighted above these are what ultimately determines the rate
Higher the concentration, more reactant particles are there per unit volume. This leads to more collisions between reactant particles and so greater successful collision frequency between reactant particles and the rate increases
This is very easy to imagine - think of a crowded room. You will most likely bump into someone else
Same as Concentration but for gases
Higher the temperature, the faster the particles move as they have more kinetic energy. So more particles will have greater or equal to the activation energy. So higher successful collision frequency so higher rate
A simple way to understand this is that when we heat a gas the KE of particles increases which leads to faster motion. This exponentially increases the rate of reaction as this favours both conditions for a reaction to occur and that's why a 10K increase in Temperature is enough to double the rate
When you add a catalyst it provides a pathway which requires a lower activation energy. So more particles have greater or equal to the activation energy. So greater successful collision frequency and rate increases
The idea of catalyst will be covered in depth under A2, but the understanding is very simple. Simply, it takes a shortcut!
Catalyst
A subtance which speeds up a chemical reaction by providing a pathway with lower activation energy and which is chemically unaltered at the end of the reaction.
When defining catalyst, we always talk about positive catalyst( which speed up a reaction ) so always use the phrase speeds up and not altered
There are catalyst which slow down the reaction also which are called inhibitors and that's all you need to know
A famous example of a use of catalyst is in Haber proccess( Ammonia production ) where Iron catalyst is used to speed up the reaction/equilibrium
There are two types of Catalysts we need to know:
Catalyst which are at the same state or phase as the reactants
A good example is Sulfuric acids in Esterification
Catalyst which are not at the same state or phase as the reactants
A good example is iron which is a solid catalyst in Haber process
More will be covered in A2 Chemistry...
Activation Energy - Ea
The minimum energy required for particles to collide successfully and cause a reaction
Usually Ea determines whether a reaction will happen or not. For example, the marksheme allows marks why Noble gases will not react and this is because they have a very high Ea, but the suitable answer is because it has a complete electronic configuration
If a reaction has a high Ea. It needs a lot of energy and it is most likely to be endothermic
Boltzmann Distribution Graphs
An important idea in Physics is that temperature is an average measurement of the kinetic energy. This means that particles at a particular temperature can have more than the average KE and some could be lower, but the total average is constant as long as the temperature remains constant
This idea is extended in chemistry also and what we need to realise is that these graphs are for a particular temperature
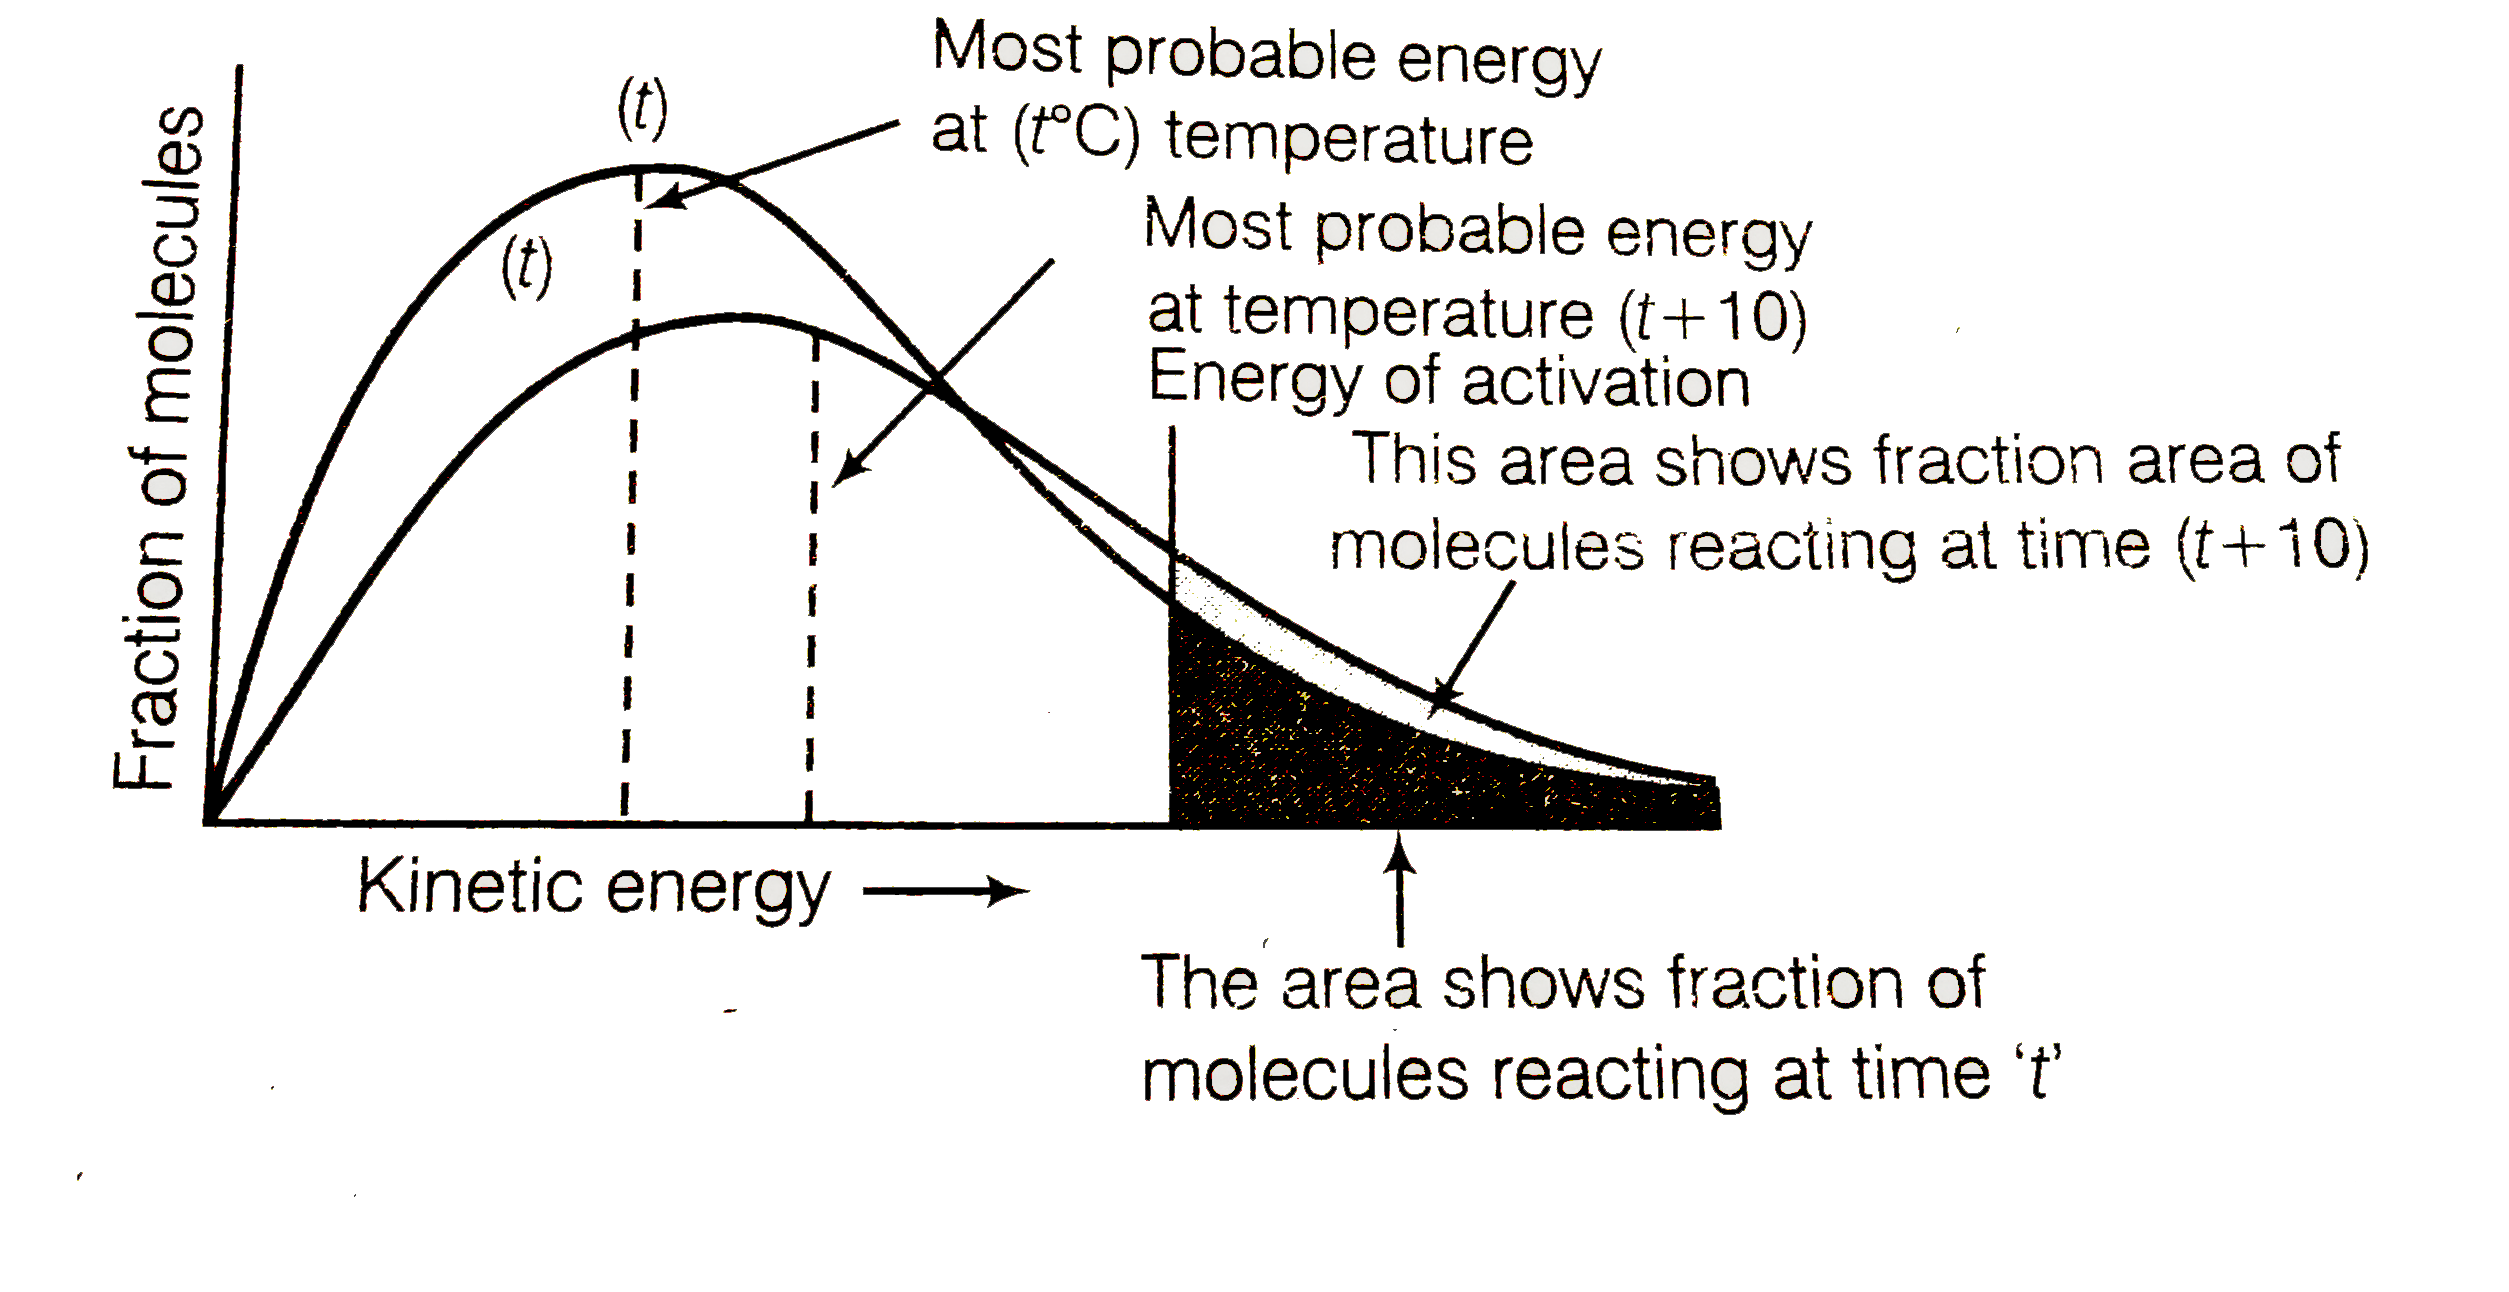
The peak of each graph shows us the energy of majority of the particles in the sample. This is known as the most probable energy. By logic, we can understand that a higher Temperature graph will have an EMP shifted to the right more than the Lower temperature graph. However, what students need to understand is that the area of the two graphs must be constant for both. This is because this represents the number of molecules ( remember this doesn't follow the basic area equation or else this will represent internal energy)
So when the EMP is shifted to the right the peak must drop to make the area constant
The same is true with a lower temperature, the EMP will shift to the left and the peak will be higher. This is a bit confusing at first but it does make sense
We will now see how each factor will affect the Boltzmann curve and how we can say the rate increases
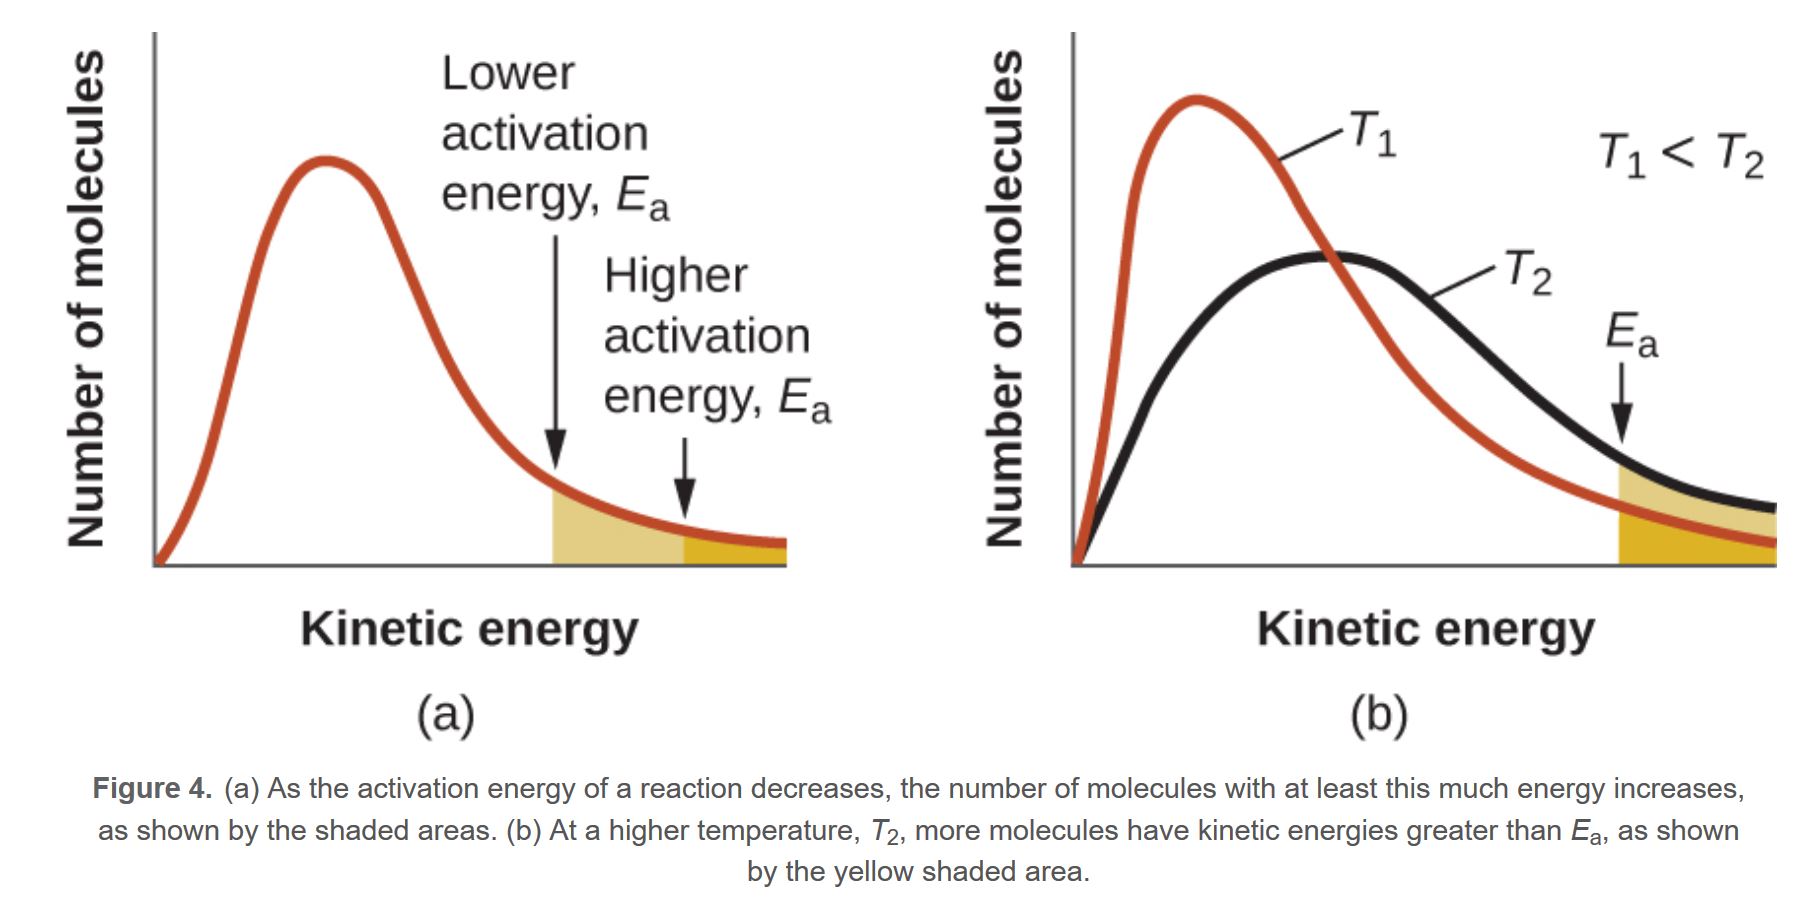
This shows how a larger temperature, increases the rate. Remember, the activation energy is usually a constant and it depends on the presense of a catalyst
In fact, increasing the temperature by 10K will double the area/rate
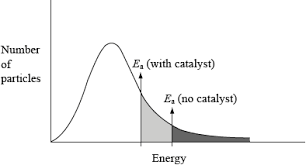
The presence of a catalyst alters the activation energy so in this case a larger area is displayed